

One new label produced four times as many identities
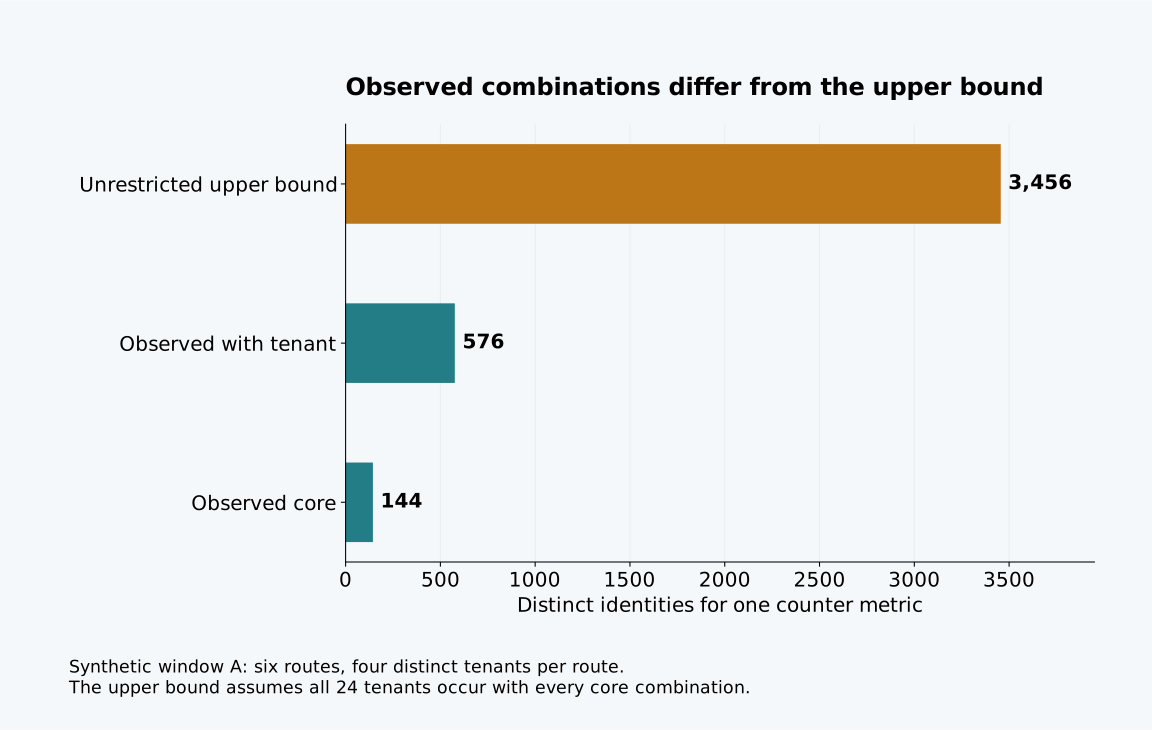
In the synthetic dataset below, adding tenant increases distinct identities for one counter metric from 144 to 576 within a window. The calculated multiplier is 4. Multiplying by all 24 tenant values would instead predict 3,456 possible identities, six times the observed count. Those answers describe different things: actual combinations in the constructed dataset and an unrestricted upper bound.
Neither number estimates a monitoring bill. The exercise counts label identities without running Prometheus, recording memory use or applying a vendor's pricing model. It gives an engineer a way to review a proposed label before translating measured backend behavior into capacity or cost decisions.
Prometheus identifies a time series by its metric name and label set, as its data model explains. A new combination creates another identity even when the underlying metric name stays unchanged. The useful question is therefore which combinations the service will actually emit and how that set changes over time.
Declare the data before multiplying it
The fixture assigns six route templates, two HTTP methods, two status values, two regions and three replica identities in each of two observation windows. Every combination of those five dimensions is present. Each route is associated with exactly four tenants, and the tenant groups do not overlap between routes. There are 24 tenant values overall, but no route serves all 24 in this constructed dataset.
Window B repeats the same logical traffic combinations with new replica names. This is a deliberate turnover scenario, not evidence about a particular deployment platform. The windows have no assigned duration. All rows represent observed label combinations in the model, rather than counters, individual requests or sampled production telemetry.
| Dimension | Assigned values per window | Constraint |
|---|---|---|
| Route template | 6 | Every core combination appears |
| Method | 2 | GET and POST |
| Status | 2 | 200 and 500 |
| Region | 2 | eu and us |
| Replica | 3 | Names change between A and B |
| Tenant | 24 overall | Four distinct tenants per route |
The core product is 6 × 2 × 2 × 2 × 3 = 144. Because each route has four tenants, the emitted tenant-bearing set is 144 × 4 = 576. The unrestricted product, 144 × 24 = 3,456, answers what could happen if every tenant appeared in every core combination. That is not how this fixture was generated.
Download the 1,152-row dataset, calculation script and results JSON. Save the script as calculate.py and run python3 calculate.py to regenerate both files using only Python's standard library.
Count sets rather than rows
For a fixed metric name, the script projects each row onto the selected label fields and inserts the resulting tuple into a set. The set size is the distinct identity count. Removing tenant from that projection collapses each group of four tenant rows into one core identity. Merely counting the 576 rows in window A would miss that distinction.
This method also exposes a missing input: exporter or collector labels. The fixture includes only its declared columns. An actual scrape may add target identity or other labels that distinguish two otherwise identical application series. Collect the emitted label set at the boundary whose capacity you are estimating, rather than assuming the application's instrumentation code describes every downstream dimension.
Prometheus's label naming guidance warns about unbounded dimensions such as user IDs. A route template, such as /orders/{id}, bounds the route vocabulary more usefully than assigning a unique path for every order. Normalization must come from a trustworthy routing contract; a loose replacement rule can merge unrelated endpoints and make the resulting metric misleading.
Stable window counts can hide turnover
Each window contains 144 core identities, so a chart showing only that count appears flat. Across both windows, the union contains 288 because every replica name changed. With tenant included, the per-window count is 576 and the union is 1,152.
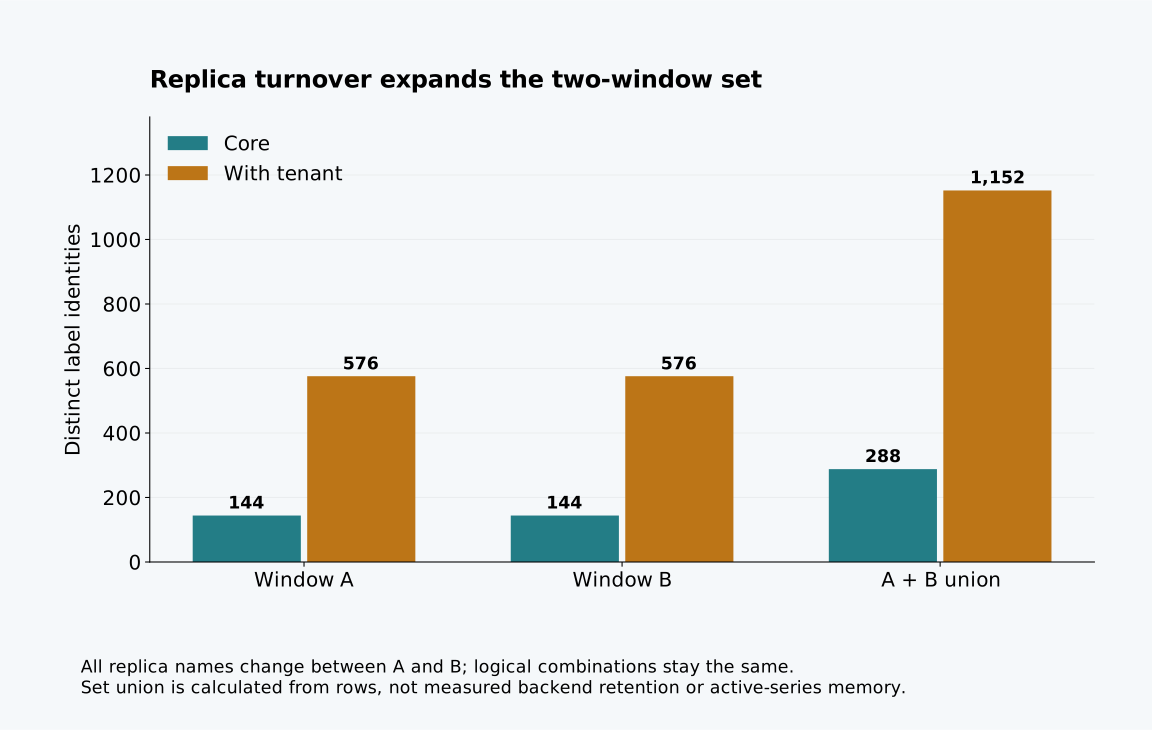
These are distinct sets over declared windows. They are not a measurement of Prometheus head-series retention or a claim that exactly 288 series would remain active in a live server. Backend lifecycle rules determine which old series remain in memory or storage. The union simply shows that a stable per-window count does not establish stable identity over a longer horizon.
Dropping replica from the core projection yields 48 identities in either window and 48 across their union. That calculation shows the dimension's effect, but it is not an instruction to strip a label from independently emitted counters. A real aggregation must preserve counter meaning, handle resets and avoid colliding samples. It also removes the ability to distinguish replica behavior in that aggregate.
Spend label capacity on a question someone must answer
Before adding a dimension, write the operational question and the response it enables. A bounded route label can help identify an endpoint-specific failure. A tenant label may support a real isolation investigation, but requires a deliberate scope, access policy and capacity assessment. Customer-level detail may belong in a separately governed diagnostic path when it is unsuitable for broad always-on metrics.
The label review worksheet asks for the emitted label set, observed distinct count, unrestricted bound, turnover horizon and the question lost by removing each dimension. It leaves capacity thresholds blank because this fixture supplies no backend benchmark from which to derive them.
If the work includes implementing collection, dashboards and alert ownership, Pharos Production describes DevOps observability with metrics, traces and SLO-based alerting, including Prometheus and OpenTelemetry. Use the worksheet to specify the instrumentation and acceptance evidence for that engagement. The published service scope does not establish a cardinality reduction or cost saving for your system.
Keep the count separate from the performance claim
Cardinality is one input to operational load. Sample frequency, retention, label lengths, query patterns and the backend's representation can change resource requirements even when the distinct count is fixed. This analysis does not assign a universal bytes-per-series value or infer a price from a count.
After measuring real emitted identities, test the proposed instrumentation against the queries and retention your team needs. Record the exact metric family and collection boundary. A histogram or another representation that emits additional series requires its own inventory; the single-counter arithmetic here should not be copied onto a different metric type unchanged.
The review decision can then name both the benefit and the observed increase. In this fixture the tenant dimension adds 432 identities per window, a fourfold total, while replica turnover doubles the two-window union. Those are reproducible properties of the supplied rows. Whether they are acceptable requires evidence from the system that will store and query them.
Sources
Documentation checked .